
Cortex Project History | Single Project Page
Work with the single project page
The single project page provides a snapshot of the project with the ability to drill into more information. It shows project highlights and details at a glance, including a project image, description, attributes organized by group, totals, and notes.
You can also analyze cost details (elements) and key performance indicators (analytics, scope, and pricing information that helps you analyze and qualify the project). The Similar projects gallery shows projects that are similar to the current project. Cortex Project History ranks similar projects based on the criteria set up by your administrator and displays them in order, from left to right, starting with the most similar project.
How do I?
View the project attributes
Click the Attributes tab to review the project attributes organized by group. If an attribute doesn't have a value for the project, it doesn't appear on the page. If a project is a Subproject (a project that is associated with and managed under a Program that represents it's own specific scope of work and contributes to the Program's overall objectives), the Program it is associated with will be noted in the System group block.
Display individual factors as attributes on the single project page
How does this work?
When you create a new rate table, Cortex Project History adds a project attribute for the table to the project field list. This attribute appears in the list of available fields (in the Factors group) for the Attributes tab, giving you the ability to display the factor on the single project page.
- Click
 and select Administration from the menu to open the Administration module.
- Click Views > Single project > Attributes in the options list.
- Drag the desired factors in the Factors group from the Available list to the Selected list to determine which factors display on the Attributes tab on the single project page.
- Drag the factors up or down in the Selected list to determine the order of the factors on the Attributes tab.
- Click Save.
View KPIs (key performance indicators) for the project
Click the KPIs tab to view the key performance indicators.
- If no KPIs are set up for the project, the KPIs tab is not available.
- If certain details do not contain data, they will be suppressed from view by default. Suppressed details are also excluded from Excel exports and chart options.
- If you have multiple KPI views set up, select the desired view from the list.
Subproject KPIs
If the project or program contains related subprojects, they can be displayed in the KPI grid view. When subprojects are displayed, each subproject appears as a separate column in the grid.
To show or hide subprojects in the grid, use the Subprojects switch in the upper-right corner of the page. Use the thumbnails switch to turn the subprojects thumbnail image visibility on and off.

To include all displayed subprojects in the KPI charts and grid analysis, click the Select all subprojects icon  at the top of the page located in the title bar (the white area at the top of the Cortex window). Select or clear the circle above a subproject column to include or exclude that specific subproject from the KPI analyses.
To change the column or row order of the subprojects, use drag-and-drop to rearrange the columns or rows in the Selected list.
Adding and removing subprojects
To add subprojects not currently displayed, click the Add subprojects icon  at the top of the page in the title bar (the white area at the top of the Cortex window). In the search window that appears, enter a project title to locate and click Search. Select the circle next to each project you want to add, then click Add subprojects at the lower right corner of the window.
To remove subprojects from view, select the circle in the subproject's column and click the Remove subprojects icon  at the top of the page in the title bar.
To select all displayed subprojects click the Select all subprojects icon at the top of the page in the title bar. All selected subprojects can be included or excluded from the view.
View the project elements
Click the Elements tab.
- To show cost details, click
 to open the item grid (bottom pane). You can expand and collapse the WBS codes in the element grid (top pane), as needed. Select a WBS code in the element grid to see the items associated with it in the item grid.
- To show the item properties, along with the cost details, click
 to open the item information pane on the right side of the page.
- To show the element grid only, click
 .
- To change how the cost data is organized, select a different group (e.g., Uniformat, MasterFormat) from the group by list located in the top left corner of the page.
The number of elements in the element group displays in parentheses next to the group description. Groups that contain numerous elements take longer to display.

Subproject elements
If the project or program contains related subprojects, they can be displayed in the Element grid view. When subprojects are displayed, each subproject appears as a separate column in the grid.
Show/Hide subprojects
Adding and removing subprojects to the grid view
Manage linked element quantity indicators
You can see which element quantities are linked to other fields by showing linked element quantity indicators on the single budget page. By default, linked element quantity indicators are not visible on the single budget page.
Show/hide linked element quantity indicators on the single budget page
- On the single budget page, click the Elements tab.
- Click
 (Settings) in the top right corner of the page.
- Click Indicators in the list.
- To show the indicators (
 ) on the single budget page, select the Element quantity lookup links option.
To hide the indicators, clear the Element quantity lookup links option.
Your selection applies to all your budgets and persists between Cortex Budget Builder sessions.
- Click Apply.
Change (overwrite) a linked element quantity
- On the single budget page, click Edit.
- Click the Elements tab.
- Expand the grid to the element level.
- Enter the desired quantity for the element in the Element quantity column.
When you enter an element quantity, Cortex changes the quantity for the linked attribute to match. Cortex keeps the linked quantities in sync.
Modify the columns shown in the grid for KPIs and elements
Click the Links tab to open a list of project links.
Cortex Project History supports two types of links:
- File: These are actual files, including Microsoft Office documents and images that you upload into Cortex Project History. You can specify which images are thumbnails for the project. The default image is the first image shown for the project.
- URL: These are links to websites.
To open a file or link, click the name.
View the project edit history
Click the Open import/update history link in the top right corner of the project page. This will open the import and update history page in a new window. You will be able to view the edit history for the current project.

Tip
To archive event rows in the Open import/update history grid, select the row or rows you want to archive then select the Archive button at the top of the grid. You will be able to view if the event is archived in the Archive column. Click on the filter icon  to apply a filter to view only archived or unarchived events.
Show or hide the project information pane
Click  or
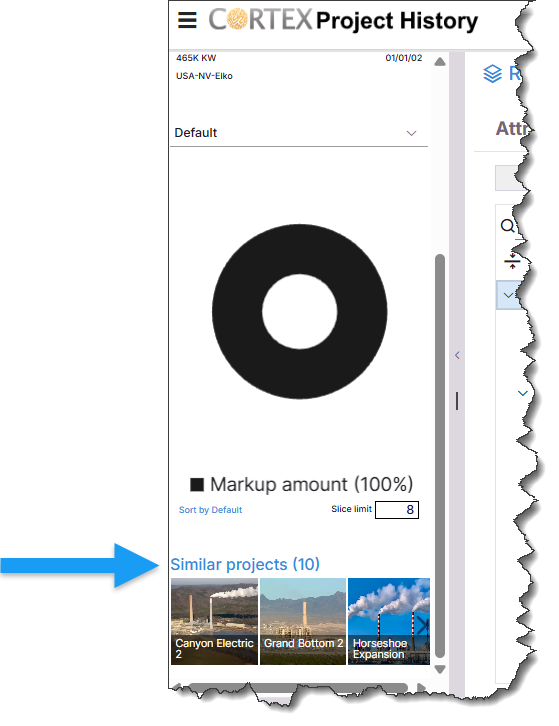
 on the pane divider to show or hide the project information pane. The pane opens on the left side of the single project page. It shows key project highlights, donut chart, and projects that are similar to it.
- To view other donut charts for the project, select the desired chart from the list. (Your Cortex configuration determines which donut charts are available.)
- To change how the donut chart legend is sorted, click one of the links at the bottom of the legend. Click Sort by Percentage to sort the legend by percentage from highest to lowest or Sort by Default to sort the legend in the order defined by the selected chart view.
- To limit the number of slices shown in the donut chart, enter the maximum number of slices in the Slice limit box. This is useful when you want to see only the largest costs associated with a project. Example (suppose you want to show the top five cost categories for the project. Enter 6 in the Slice limit box. Cortex displays the top five cost categories in the chart and lumps the costs for the remaining categories in a slice labeled Other.)
- To view the similar projects, click the link at the bottom of the pane. If there are no other similar projects to view, there will not be a link available.
Compare this project to similar projects
If Cortex Project History contains other projects similar to this one, a Similar projects link appears at the bottom of the project information pane (left pane on the page) and shows the number of similar projects in parentheses; e.g., Similar projects (10).
Click  on the title bar (the white area at the top of the Cortex window) to display the current project and similar projects display side-by-side in a tabular layout. The current project is selected as the baseline project and appears in the first project column.
To view how the similarity score was generated, place your cursor in the Similarity score field and hover over the  (info) icon.
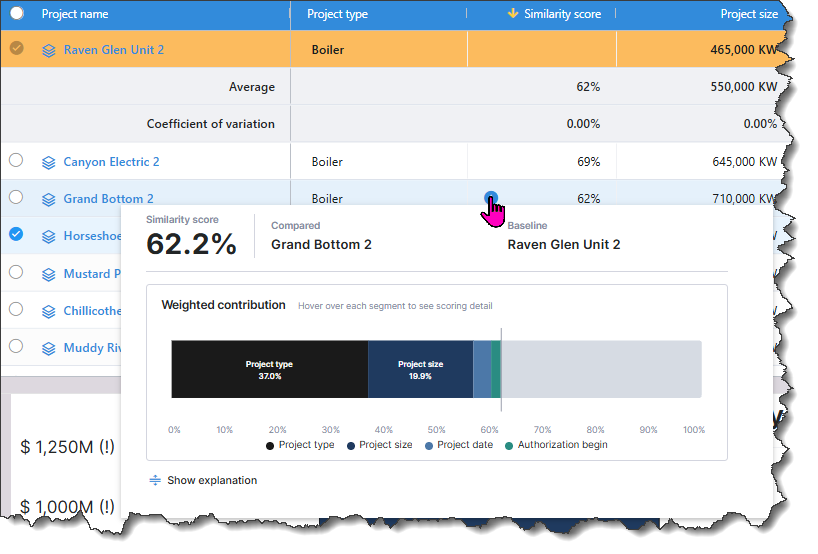
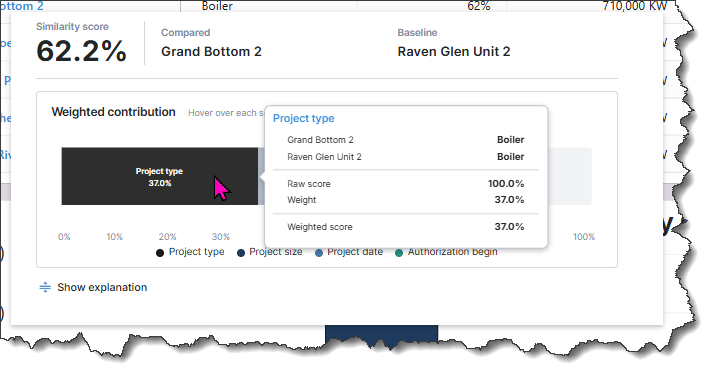
Hover over a segment to view it's scoring detail.
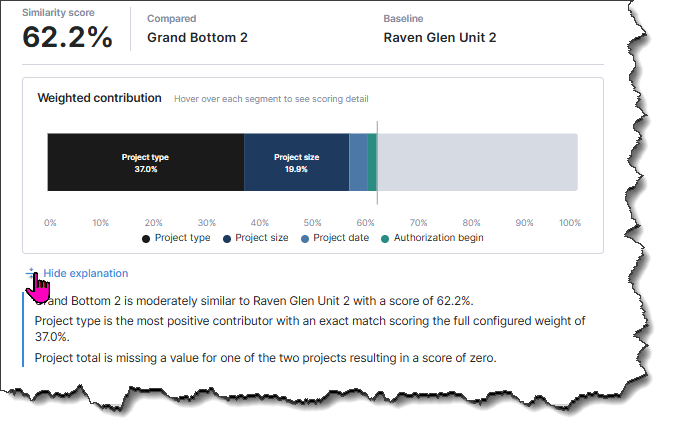
Click Show explanation at the bottom of the detail window for a thorough explanation of how the score is determined.
View the project location on a map
In the title bar (the white area at the top of the Cortex window), click  (Maps) to open a map showing the location of the project.
The map works similar to Google Maps. For example, you can switch between showing satellite imagery and the street map. You can also drag Pegman onto the map to see the project site in street view.
How does Cortex determine the project location?
Cortex uses system fields to store a project's latitude and longitude. Anytime a project is imported, edited, or refreshed, the system checks the Address line field for a valid address or location to derive the latitude and longitude values. (Note that the administrator can set up an expression for the Address line field that concatenates your separate address fields (address, city, state, and zip) to form a complete address for mapping purposes. If desired, the project name field can be included in the expression too.) Entering a project-specific address in the Address line field will produce the best result for mapping.
If a valid address or location is not found in the Address line field, Cortex checks the Project location field to see if it can determine a latitude and longitude for the project.
When you use the project mapping feature, only projects that have latitude and longitude values appear on the map. The quickest way to populate the latitude and longitude fields for all your projects is to run the Refresh feature in the Administration module.
What if my generation of latitude and longitude coordinates did not successfully generate?
If your latitude and longitude coordinates did not successfully generate, you can request an the Admin preform a data refresh to reprocess the records.
Update a project
- To download a project import template containing the project data, click
 next to the project name, and click Download import template with data> template name.
- When the template opens in Microsoft Excel, review it and make changes as needed.
- Save your changes.
- To import the modified project import template, click Project imports/updates on the
 menu.
 Only users who are set up as administrators in Cortex have access to this feature.
- Drag the Excel project import file and drop it on the Project imports/updates page. You can also click Select file to browse to the import file, select it, and then click OK.
The status of the import displays in the grid at the bottom of the page.
The system performs minimum validation on the project import file to ensure that it uses a valid template and contains the necessary data to work properly in Cortex Project History. For example, every project must have a project date and project location.
- Click Replace project to replace the existing project.
Learn about the Project Replacement Warning
When a project ID in the import template matches a project ID in Cortex, the system warns you that the import process will replace the project with the project data in the import template. Your response to the warning determines whether the existing project is replaced or skipped during the import.
To apply your response to all matching projects found during the import process and dismiss all future project replacement warnings, select the Apply to all when importing multiple project updates check circle; otherwise, clear this check circle. When this option is selected, a yellow banner displays at the top of the Project imports/updates page alerting you that you opted to either replace projects or skip importing projects when the project ID matches and that all future project replacement warnings will be dismissed. This setting persists for all future project imports until you click the reset link in the banner.
- To replace the existing project, click Replace project.
- To skip the import for this project, click Skip.
Subproject and  (Edit project fields) features are not included in Cortex 365.