
Cortex Project History | Compare Projects
Compare projects
You can compare two or more projects side-by-side in Cortex Project History.
To compare projects
- In the project collection, select the check circle (first column) for each project you want to compare. To select all the projects in the list, click the check circle located next to the Project name column heading.
- Click
 (Compare projects).
The selected projects display side-by-side in a tabular layout with the project attributes in the first column. If all the projects contain 0 (zero) for a particular attribute, that attribute will not appear in the comparison.
Expand and collapse attribute groups on the Compare projects page as needed to see the information you need.
Tip
You can drag and drop a project from your favorites or the clipboard to the Compare projects page. Cortex Project History adds the new project column to the end of the comparison.
How do I?
Select a baseline project
- To select the project, click the check circle located at the top of the project image.
- Click
 . The selected project moves to the first column.
As you scroll through the project columns, the baseline project remains visible in the first column.
To cancel the baseline project selection, click  .
Tip
You can also select a baseline project by dragging a project from the comparison, or from the favorites, or from the clipboard gallery, and dropping it at the baseline position (first column) in the comparison. The + symbol, baseline project icon, and project name appear as you drag the project to the baseline position.
Likewise, to remove a baseline project, you can drag and drop it on the other comparison columns.
Review attributes across projects
Click the Attributes tab.
Expand and collapse groups as needed.
Change the attributes for the comparison
- Click
 (Settings), and then click Settings in the list.
- On the Attribute rows tab, move attributes between the Selected list and Available list to select the desired compare attributes.
Change the attribute statistic columns
- Click
 (Settings), and then click Settings in the list.
- On the Attribute statistics tab, move statistic columns between the Selected list and Available list to select the desired statistic columns.
To reset the default column selections
Click Reset to default in the Configure Grid: More Compare Columns window or Configure Grid: Statistic Columns window, depending on which defaults you want to reset.
Ignore zeros tip
The Ignore zeros check circle determines whether the statistics include or exclude projects that contain zeros. If a project in your comparison contains a zero and is not applicable to your scenario (e.g., you are trying to obtain an average of all the projects with values), select the Ignore zeros check circle. However, if it does apply and you want it included in the Average and other statistic calculations, clear the Ignore zeros check circle.
Statistics always ignore null (blank) values. Depending on your suppression settings, some zero values can appear blank. You can download an import template for a project to see what values the fields actually contain.
Ignore baseline tip
The Ignore baseline check circle determines whether the statistic values include or exclude the baseline project. Select this check circle to exclude the baseline from the statistic values. Otherwise, clear this check circle to include the baseline project in the statistic calculations. This setting applies anywhere that statistics are visible in Cortex Project History.
View KPIs (key performance indicators)
Click the KPIs tab to view the key performance indicators. (If no KPIs are set up for the project, the KPIs tab is not available.)
- To view the key metrics for the projects, select Key metrics from the group by list.
- To switch back to key quantities, select Key quantities from the group by list.
- Expand and collapse metrics groups as needed.
- By default, the Quantity column displays for each project being compared. To show a different column for the projects, click
 (Settings) and select the desired column.
- If certain KPI details do not contain data, they will be suppressed from view by default. Suppressed details are also excluded from Excel exports and chart options.
Review elements across projects
Click the Elements tab .
- To change how the cost data is organized, select a different different group (e.g., Uniformat, Discipline, MasterFormat, etc.) from the group by list located in the column heading row (above the element descriptions).
- Expand and collapse groups as needed.
Set up element quantities (overlines)
- Using a lookup for an element: The administrator selects an attribute to use for the element quantity. Cortex Project History looks up the attribute quantity and uses it for the element quantity. For example, the administrator could configure Cortex Project History so that the Project size attribute is the element quantity for Direct costs.
- Aggregating the quantity for an element: This method adds up all the quantities for the child elements that have a specific unit of measure. The administrator determines the unit of measure to use for aggregating the child element quantities. For example, the aggregate quantity for the Foundations element could be based on CY. In this case, Cortex Project History adds up the quantities for all the child elements (with CY for the unit of measure) in the Foundations group and uses the sum for the Foundations element quantity.
If an element quantity was entered for a project, that quantity displays in the Element quantity column instead of the lookup quantity or aggregated quantity.
Select columns for the comparison
You can select columns (up to five) for comparing projects in elements view. For example, you might compare the Element quantity, Unit price, and Element total.
Select the compare columns first, and then select the statistic columns for the comparison. Note that a statistic column is available for each of the selected compare columns. For example, if you selected Element quantity, Unit price, and Element total as your compare columns, a statistic column is available for each of them:
- Average: Element quantity
- Average: Unit price
- Average: Element total
- and so on...
To change the element columns for the comparison
- Click
 (Settings), and then click Settings in the list.
- On the Element columns tab, move columns between the Selected list and Available list to select the desired compare columns (up to five).
To change the element statistic columns
- Click
 (Settings), and then click Settings in the list.
- On the Element statistics tab, move statistic columns between the Selected list and Available list to select the desired statistic columns.
To reset the default column selections
Click Reset to default in the Configure Grid: More Compare Columns window or Configure Grid: Statistic Columns window, depending on which defaults you want to reset.
Ignore zeros tip
The Ignore zeros check circle determines whether the statistics include or exclude projects that contain zeros. If a project in your comparison contains a zero and is not applicable to your scenario (e.g., you are trying to obtain an average of all the projects with values), select the Ignore zeros check circle. However, if it does apply and you want it included in the Average and other statistic calculations, clear the Ignore zeros check circle.
Statistics always ignore null (blank) values. Depending on your suppression settings, some zero values can appear blank. You can download an import template for a project to see what values the fields actually contain.
Ignore baseline tip
The Ignore baseline check circle determines whether the statistic values include or exclude the baseline project. Select this check circle to exclude the baseline from the statistic values. Otherwise, clear this check circle to include the baseline project in the statistic calculations. This setting applies anywhere that statistics are visible in Cortex Project History.
Display individual factors on the Compare projects page
How does this work?
When you create a new rate table, Cortex Project History adds a project attribute for the table to the project field list. This attribute appears in the list of available fields (in the Factors group) for the Compare Attributes view, giving you the ability to display the factor on the Compare projects page.
- Click
 and select Administration from the menu to open the Administration module.
- Click Views > Compare > Attributes view in the options list.
- Drag the desired factors in the Factors group from the Available list to the Selected list to determine which factors display in Attributes view on the Compare projects page.
- Drag the factors up or down in the Selected list to determine the order of the factors in the view.
- Click Save.
Change the visible statistic columns
The first column on the Compare projects page contains the average for each attribute or element, depending on the current tab (Attributes or Elements). Average is one of several available statistic columns (Average, High, Baseline to median, Median, Spread, Low, and more). These columns help you analyze the totals for the projects being compared.
To change the visible statistics columns
- Click
 (Settings), and then click Settings in the list.
- Click the Attribute statistics or Element statistics tab based on what you want to change.
- Move the desired columns to the Selected list. Note that the two Baseline statistic columns are available only when a baseline project is specified.
Ignore zeros tip
The Ignore zeros check circle determines whether the statistics include or exclude projects that contain zeros. If a project in your comparison contains a zero and is not applicable to your scenario (e.g., you are trying to obtain an average of all the projects with values), select the Ignore zeros check circle. However, if it does apply and you want it included in the Average and other statistic calculations, clear the Ignore zeros check circle.
Statistics always ignore null (blank) values. Depending on your suppression settings, some zero values can appear blank. You can download an import template for a project to see what values the fields actually contain.
Ignore baseline tip
The Ignore baseline check circle determines whether the statistic values include or exclude the baseline project. Select this check circle to exclude the baseline from the statistic values. Otherwise, clear this check circle to include the baseline project in the statistic calculations. This setting applies anywhere that statistics are visible in Cortex Project History.
Reorder the projects on the Compare projects page
To move a project, select the project image title bar, drag the project to the desired position, and drop it.
Open a project from the Compare projects page
Click anywhere on the project image to open the project in Cortex.
Add a project for comparison from the Compare projects page
- Click
 (Add) and select Add Projects from the drop down menu.
- Enter a name (or any reference word, letter, or number) of a project name, type, or location and click Search.
- A list of available projects relating to your search will be displayed in the Project search window. If you prefer a more defined search, use Project Filters (left panel) to apply more specific parameters to your project search. Use the slide bar to scroll up and down in the panel to view the various filter types.
- Click on the line below a filter type to reveal a drop down list of options available for that type.
You are not limited to only one selection. Cortex will allow you to select more than one type from the drop down list and will apply all the types selected. Click on X beside any of your choices to remove that option from the filter.
- Click on the line to the right of a data field to reveal a drop down list of UOM's (unit of measures) options available (i.e. cubic yards or square feet, days or months).
You are not limited to only one selection. Cortex will allow you to select more than one of the available UOM's (unit of measures) to apply to your filter if you choose (i.e. cubic yards AND square feet, days AND months). Click on X beside any of your choices to remove that option from the filter.
To remove all filters selected for a single filter type, click the Undo icon  that appears beside the filter type.
Change your Add Project window view layout
Reorganize the columns
You can reorganize the Add Project columns by clicking the column header and dragging it to your preferred location.
Apply filters to the columns
You can apply filters to each column by hovering over the column header and clicking on the White Filter icon that appears. A drop down list of available filter choices will display when you click the icon. Select Apply when finished
Tip
In the Project Name, Project Type, and Project Location column filters, you can check Select All (the default first choice in the item filter list) to select all choices or uncheck Select All to uncheck all choices. All choices are initially selected by default. Check or uncheck any individual item(s) you prefer to be applied to or omitted from the filter.
In the Project Price, Project Size, Project Total, and Project Date column filters, you can apply logic (equals, does not equal, less than, less than or equal to, greater than, greater than or equal to) to your cost/date filter.
Change the order of the of projects
To change the order of the project list, click on any column header you would prefer the list to be sorted by (i.e. sort by project total) and a yellow arrow (  ) will appear. Click on the arrow to control the ascending or descending order of that column.
Change which indicators are visible in the projects list
You can change the indicators shown in your Add Projects view, not just turn them on and off.
- Click on
 (Settings) in the upper right of the window and select Indicators from the drop down list.
- You can select General or Outlier in the Indicators pop-up window to make changes to their respective settings.
General settings
Under General settings, you can turn on/off the outliers and/or the comments. Turning them off will remove them from visibility in the projects list.
Outlier Settings
In the Outliers settings, you can adjust the data set parameters.
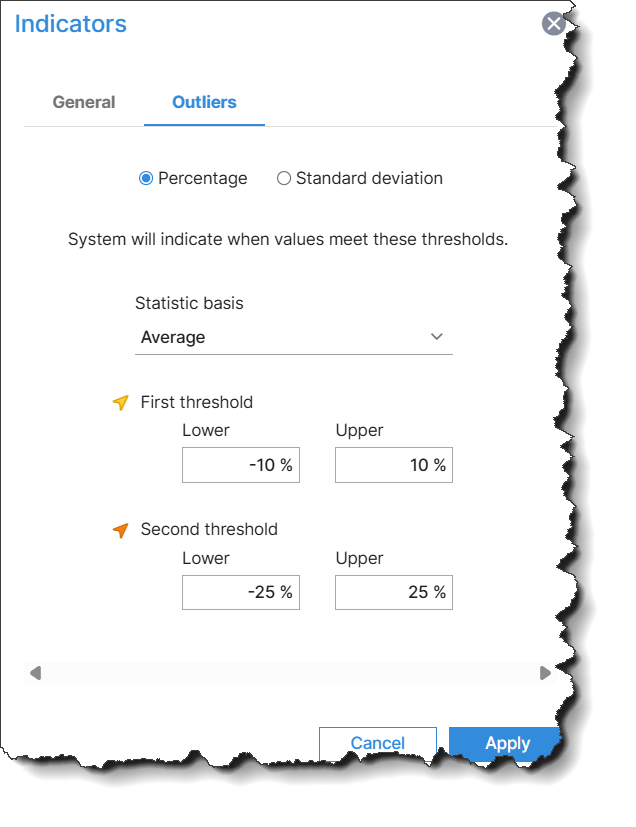
Percentage
Percentage outliers allow you to set and apply a Statistic basis (Average or Median) to your results. Specify the Statistic basis to use as the threshold percentages for the First and Second thresholds. The outlier arrow points up or down to indicate how it compares to the specified outlier type.
Standard Deviation
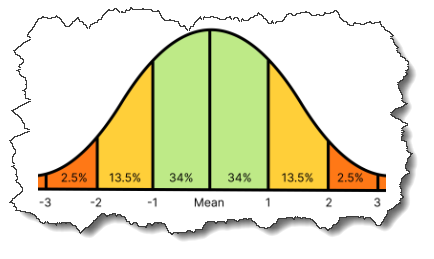
Standard deviation (how much the data points differ from the average) is a Cortex preset range you can choose in lieu of setting your own specific range.
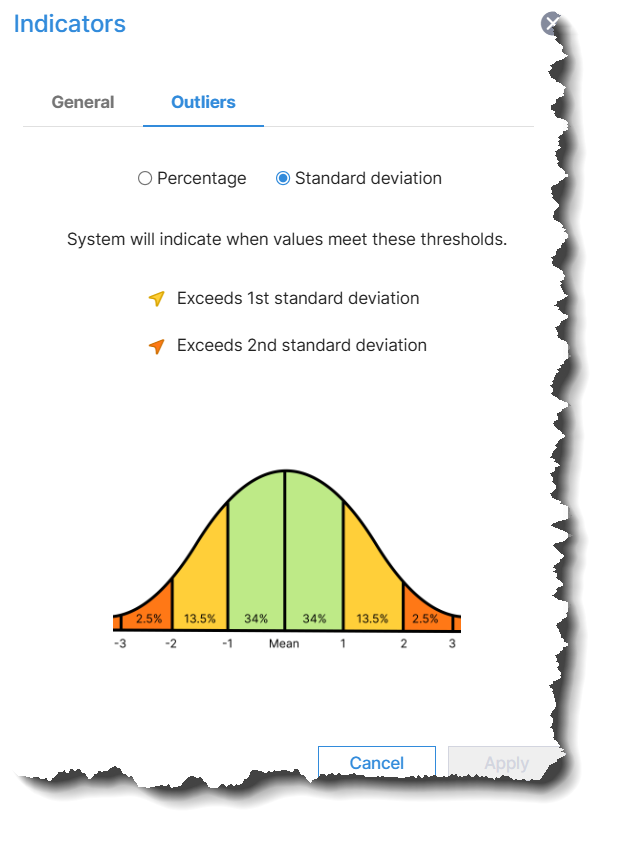
- Click on Apply to apply your indicator changes to your project list.
Show/hide indicators
You can show/hide indicators without changing the current indicator options in by moving the Indicators switch (located in the top right corner of the page) to the on or off position.

Save Add Projects layout views
You can save the changes you make to your view in the Add Projects settings for use anytime.
- Click on (Settings) in the upper right of the window.
- Select Save view to overwrite the default view and save your current view.
- Select Save view as to give the view a name and save the layout.
After selecting Save View as, give the view a name and click Save.
Tip
You can save this view as a public view (the view can be seen and used by other users) by leaving the default check mark checked in the Shared view circle or as a personal view (not visible for others to use) by unchecking the Shared view circle.
Column Settings for Add Projects layout
You can add or remove column types from your Add Projects list.
- Click on (Settings) in the upper right of the window. Then select Settings from the drop down options that appear.
- Click on Columns in the Setting window and scroll up and down the panel to choose which columns you would like to make visible in your Add Projects project list. If you know what type you want, you can also type it into the search field. Double click the column types you would like to include in your view. Notice when you double click the types they appear to the right under Selected. This is the list of all column types currently available, and/or to be added, to your Add Projects project list layout.
You can easily remove column types also. Select a type from the Selected panel on the right and click the orange X that appears beside the type(s).
- When you have made all your changes to the column types, click Save in the bottom right of the window.
Change the attribute statistic rows
- Click (Settings), and then click Settings from the drop down list.
- On the Statistic rows tab, scroll up and down in the left panel to choose which rows you would like to make visible in your Add Projects project list. If you know what type you want, you can also type it into the search field. Double click the row types you would like to include in your view. Notice when you double click the types they appear to the right under Selected. This is the list of all row types currently available, and/or to be added, to your Add Projects project list layout.
You can easily remove Statistic row types also. Select a type from the Selected panel on the right and click the orange x that appears beside the type(s).
Ignore zeros tip
The Ignore zeros check circle determines whether the statistics include or exclude projects that contain zeros. If a project in your comparison contains a zero and is not applicable to your scenario (e.g., you are trying to obtain an average of all the projects with values), select the Ignore zeros check circle. However, if it does apply and you want it included in the Average and other statistic calculations, clear the Ignore zeros check circle.
Statistics always ignore null (blank) values. Depending on your suppression settings, some zero values can appear blank. You can download an import template for a project to see what values the fields actually contain.
Ignore baseline tip
The Ignore baseline check circle determines whether the statistic values include or exclude the baseline project. Select this check circle to exclude the baseline from the statistic values. Otherwise, clear this check circle to include the baseline project in the statistic calculations. This setting applies anywhere that statistics are visible in Cortex Project History.
- When you have made all your changes to the Statistic row types, click Save in the bottom right of the window.
Reset Add Project default settings
To reset all Add Project window settings, click on Default in the upper right of the window next to (Settings). You can also click on (Settings) in the upper right of the window and select Default from the drop down list.

- Select the project or projects you would like to add for comparison and click Add projects.
Open a project from the Add projects window
Click on the project name in the list to open the project in Cortex. You must close the Add Projects window to be able to view the project details.
Remove a project from the Compare projects page
- Select the
 (Check Circle) on the project image.
- Click
 (Remove project).
Show/hide indicators
You can show/hide indicators without changing the current indicator options in Settings by moving the Indicators switch (located in the top right corner of the page) to the on or off position.
Show/ hide project thumbnails (images)
You can show/hide the project thumbnails by moving the Thumbnails switch (located in the top right corner of the page) to the on position or off position.

Select all the projects on the Compare projects page
Click on the title bar (the white area at the top of the Cortex window).
View program, project, and subproject locations on a map
In the title bar (the white area at the top of the Cortex window), click  (Maps) to open a map showing the location of all the projects in the collection. The map works similar to Google Maps. For example, you can switch between showing satellite imagery and the street map. You can also drag Pegman (peg-like character in maps) onto the map to see the project site in street view.
- To open a popup showing more project details, hover over the project pin. Click the project pin if you want to keep it open.
- To open the project and see even more details, click the project name in the popup. The single project page opens in a separate browser tab.
How does Cortex determine the project location?
Cortex uses system fields to store a project's latitude and longitude. Anytime a project is imported, edited, or refreshed, the system checks the Address line field for a valid address or location to derive the latitude and longitude values. (Note that the administrator can set up an expression for the Address line field that concatenates your separate address fields (address, city, state, and zip) to form a complete address for mapping purposes. If desired, the project name field can be included in the expression too.) Entering a project-specific address in the Address line field will produce the best result for mapping.
If a valid address or location is not found in the Address line field, Cortex checks the Project location field to see if it can determine a latitude and longitude for the project.
When you use the project mapping feature, only projects that have latitude and longitude values appear on the map. The quickest way to populate the latitude and longitude fields for all your projects is to run the Refresh feature in the Administration module.
Compare this project to similar projects using similarity scoring
Compare projects in a portfolio
Remove portfolios from comparison