
Cortex Project History | Element Collection
Work with the element collection
The element collection provides a tabular layout of all the elements (elements are similar to overlines in Sage estimates. They are aggregated cost subtotals, usually aggregated by your Uniformat or CSI levels, or whatever coding scheme you use for totaling your unit costs. They display in the top pane of the single project page when viewing elements.) that meet your search criteria. This view is helpful for reviewing elements across your projects.
You can filter (apply attribute criteria to narrow the search results) the search results, view more information about an element, add and remove columns, change the column order, and resize columns in the element collection.
How do I?
Filter the elements
You can filter elements in the search results or an element collection.
To filter elements by element or project attribute
- In the element search results or element collection, click
 to expand the filters pane if it is not already open.
- Elements do not have many fields available for filtering, but their parent projects have attribute fields that you can use for filtering.
- Click the Element filters or Project filters tab based on the attributes you want to filter by.
- Select the attributes to use for filtering the elements. You can specify ranges for numeric and date attributes.
- If a filter option has different units of measure, a unit list is available so you can select one or more units for filtering.
- To clear all the filters, click Clear all.
- To collapse the filters pane, click
 .
To filter elements by a column
- Hover on the column heading and click
 to open the filter window.
- Complete the settings in the filter pane. The settings vary based on the field type:
- Alphanumeric field: Select the values you want to filter by. For example, when you filter by Project type, select the project types you want to filter the results by.
- Numeric field: Select a comparison operator (Greater than, Equals, Not equal, Less than, etc.) from the list and enter a value in the box.
- To set another condition for the filter, select AND (an element must meet both conditions) or OR (an element can meet either or both conditions), select another comparison operator, and enter a value for the condition. Repeat this process to set additional filter conditions, as needed.
- Date field: Select a comparison operator (Greater than, Equals, Not equal, Less than, etc.) from the list and select or enter a date for filtering the results.
- To set another condition for the filter, select AND (an element must meet both conditions) or OR (an element can meet either or both conditions), select another comparison operator, and enter a value for the condition.
- Click Apply to apply the column filter.
- Repeat steps 1-3 to set additional column filters as needed.
- To clear a filter, hover on the column heading, click , and click Reset in the filter pane.
View more information about an element
To open the single project page for the project associated with a specific element, click the element description. The single project page opens with the element highlighted on the Elements tab.
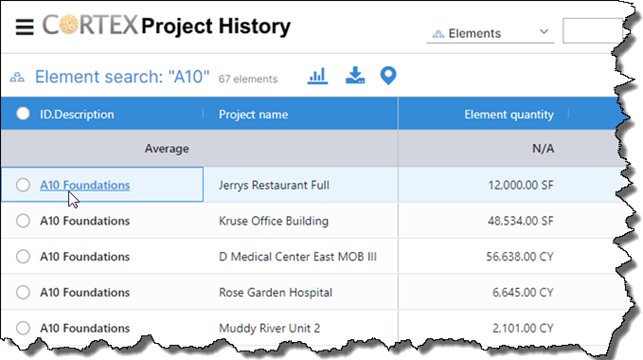
See the projects associated with this element
Click the project count link in the title bar (the white area at the top of the Cortex window) to show the project collection. To return to the element collection, click the element count link in the title bar.
Add project fields to the grid view
Why would I do this?
Adding project fields to your grid view can help to better understand the nature of the element and the item records.
- To add a project field to the grid view, click
 (Settings) in the top-right corner of the element collection, then select Settings from the list.
- Click on the Columns tab and select any of the project fields available in the Available column to add to the Selected column.
- Once finished adding all the project fields you need, click Apply at the top of the page.
Remove elements from the collection
To remove one or more elements from the collection, select the element's check circle and click  (Remove elements). This removes the elements from the collection, but not from Cortex.
Select a different grid view
- Click
 (Settings).
- Select the desired view.
- Click on either the Program / Project tab or the Subprojects tab.
The name of the view currently in effect for the collection displays in the top right corner of the application window. If you make changes (resize a column, reorder the columns, etc.) to the view while working in the collection, an asterisk displays next to the view name indicating changes were made.
Your changes are temporary and persist until you select a different view for the collection. To make permanent changes to a view, an administrator needs to use Views > Element collection > Grid views in the Administration module.
Modify the collection view
- Click
 (Settings), located above the grid, and then click Settings in the drop down menu to open the settings page.
- Click on either the Program / Project tab or the Subprojects tab.
- On the Columns tab, the Selected list shows the columns that currently appear in the grid.
- To add a column, drag the desired column from the Available list and drop it in the Selected list. Expand and collapse column groups and use the Search box as needed to locate the desired column in the Available list.
- To remove a column, double-click the desired column in the Selected list. You can also select the column and click X on the selected column to remove it from the Selected list.
- To change the column order, use drag-and-drop to rearrange the columns in the Selected list.
- Do the following to change the visible statistic rows (These rows help you analyze the totals for the elements. They are gray and appear at the top of the collection.):
- Click the Statistic rows tab located above the Available list.
- Move the desired statistic rows from the Available list to the Selected list to make them visible in the collection.
Ignore zeros tip
The Ignore zeros option determines whether the statistic rows include or exclude elements that contain zeros. If an element in the collection contains a zero and is not applicable to your scenario, select the Ignore zeros option. However, if it does apply and you want it included in the Average and other statistic calculations, clear the Ignore zeros option.
Statistics always ignore null (blank) values. Depending on your suppression settings, some zero values can appear blank. You can download an import template for a project to see what values the fields actually contain.
Ignore baseline in statistic values tip
The Ignore baseline option determines whether the statistic values include or exclude the baseline element. Select this option to exclude the baseline element from the statistic values. Otherwise, clear this option to include the baseline element in the statistic calculations. This setting applies anywhere that statistics are visible in Cortex Project History.
- When you finish modifying the view, click Save.
Tip
After you modify the collection view, your changes persist between your Cortex Project History sessions unless you select a different view.
Resize columns
Click and drag the divider between columns to resize a column.
Remove one or more element rows from the collection
- Select the check circles of the element rows you want to remove.
- Click
 .
- Select the desired option: Remove selected elements or Remove unselected elements.
Select a baseline element
- Click the row circle to select the element.
- Click
 . The baseline element moves to the top of the grid and is shaded orange.
- As you scroll through the element rows, the baseline element remains visible at the top.
- To remove the baseline element selection, click
 .
- To replace the current baseline element, select the element you want to replace it with and click
 .
Change the visible statistic rows
Statistic rows (Average, High, Baseline to median, Median, Spread, Low, and more) help you analyze the totals for the elements. Statistic rows are gray and appear at the top of the collection.
Do the following to change the visible statistics rows:
- Click
 (Settings), located above the grid, and then click Settings from the drop down menu to open the settings page.
- Click the Statistic rows tab.
- Move the desired statistic rows from the Available list to the Selected list to make them visible in the collection.
- When you finish, click Save.
Ignore zeros tip
The Ignore zeros option determines whether the statistic rows include or exclude elements that contain zeros. If an element in the collection contains a zero and is not applicable to your scenario, select the Ignore zeros option. However, if it does apply and you want it included in the Average and other statistic calculations, clear the Ignore zeros option.
Statistics always ignore null (blank) values. Depending on your suppression settings, some zero values can appear blank. You can download an import template for a project to see what values the fields actually contain.
Adjusting the Ignore zeros setting will universally apply across all applications utilizing the statistic values.
Ignore baseline in statistic values tip
The Ignore baseline option determines whether the statistic values include or exclude the baseline element. Select this option to exclude the baseline element from the statistic values. Otherwise, clear this option to include the baseline element in the statistic calculations. This setting applies anywhere that statistics are visible in Cortex Project History.
Adjusting the Ignore baseline setting will universally apply across all applications utilizing the statistic values.
Recalculate statistics
If you set a filter and change the makeup of the collection when the statistic rows are visible, click Recalculate statistics in title bar (the white area at the top of the Cortex window) to recalculate the statistic values. Dashes (-) appear in the statistic rows and the Recalculate statistics link becomes available in the title bar when statistics need to be recalculated.