
Cortex | Charts
Work with charts
Cortex provides several types of charts for representing your data visually. The following table shows the different chart types and where they're available in Cortex.
|
Chart type |
Single project page (Elements only) Single budget page (Elements) |
Project collection Element collection Item collection Budget collection |
Compare page (Attributes, KPIs, & Elements) |
Single Portfolio (Attributes, Elements, & Projects) |
|
Bar charts (Bar charts present data using rectangular bars with lengths proportional to the values that they represent.) |
|
|
|
|
|
Line charts (Line charts present data as a series of data points connected by straight line segments. They are useful for visualizing trends or changes over time.) |
|
(Project, Element, and Item collections only when the Time series option is selected) |
|
|
|
Donut charts (Donut charts present quantitative information using a circle with a hole in the middle (donut) divided into slices in which the relative sizes of the slices correspond to the relative sizes of the quantities.) |
|
|
|
|
|
Scatter charts (Scatter charts present two values as data points on the X and Y axes to show the correlation between them.) |
|
|
|
|
|
High-low charts (100%) (High-low charts connect the high and low points for sets of data, and show the average and baseline for each high-low line.) |
|
|
|
(Elements only) |

Do settings persist for charts?
Value selections persist between charts, when applicable. For example, suppose you select the Project size value for the bar chart and then select the donut chart. The donut chart will be based on the Project size value.
Why do I see one chart for each selected cost group when I view charts from the Compare page?
Because the units of measure vary from one cost group to another, Cortex creates individual charts for each cost group when you view charts from the Compare page. The exception is the scatter chart, which always displays as a single chart.
To see a large version of one of the tiled charts, click  on the tiled chart and select View full screen from the menu.
How do I?
Open and close the chart panes
To open the chart panes, click  .
To close the chart panes, click  .
Create bar charts
- To open the chart panes, click
 from one of the following:
- Single project or single budget page with Elements selected
- Project, element, item, or budget collection
Tips
- You can sort the collection by a specific column before you open the chart panes and the chart will reflect that sort order. For example, if you sort the collection by the Grand Total column, the chart will sort in order by grand total.
- You can select the projects, elements, items, or budgets in the collection to use for the chart before opening the chart panes. To include all the objects in the chart, do not select any of them in the collection (or select all of them).
- You can filter the collection, as needed, before opening chart view.
- Compare projects or Compare budgets page
- In the Chart options pane, click
 .
- Choose from the following options:
- Regular, Grouped, or 100%: Display regular, grouped (This option groups the data by the field you select in the Chart options. It is available for bar charts created from the collections, single project page, and single budget page with Elements selected.), or 100% (This option displays a stacked bar chart that shows the percentage of the total for each selected value.) bars.
- Columns or Rows: Display the bars in columns (vertically) or rows (horizontally).
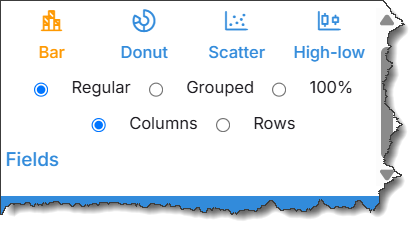
- If the cost groups (Uniformat, MasterFormat) list is available, you can select a cost group to determine how the data is grouped in the chart.
- In the field list, select the data to show in the chart (e.g., Project size, Labor amount, Equipment, or Construction duration).
Use the Search box to quickly locate data fields in the list.
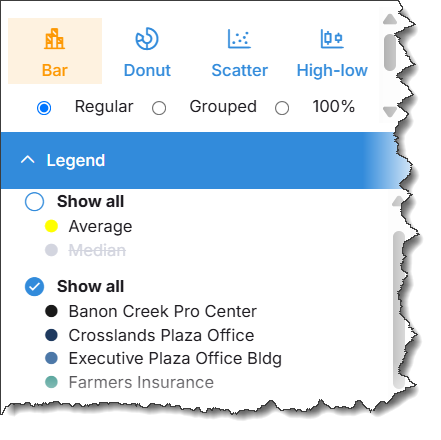
- To remove some of the projects from the chart, expand the Legend and click each project you want to remove. To show all the projects in the chart, select the Show all check circle.
Create line charts using Time series
- To open the chart panes, click
 from a project, element, or item collection.
Tips
- You can select the projects, elements, or items in the collection to use for the chart before opening the chart panes. To include all the objects in the chart, do not select any of them in the collection (or select all of them).
- You can filter the collection, as needed, before opening chart view.
- In the Chart options pane, switch Time series to the on position to base the chart on a time interval. The Line chart is available only when Time series is set to on.
- In the Chart options pane, click
 .
- Choose the desired time interval: Month, Quarter, or Year.
- In the field list, select the data to show in the chart.
- To remove some of the projects from the chart, expand the Legend and click each project you want to remove. To show all the projects in the chart, select the Show all check circle.
Using Group by with Line or Bar charts
You can organize chart data by using Group by. This feature is available for (Bar charts) and (Line charts) used in the project collection. This option allows you to chart results by available single-select list fields and display statistical values within each group.
- To open the chart panes, click from a project, element, or item collection.
Tips
- You can select the projects, elements, or items in the collection to use for the chart before opening the chart panes. To include all the objects in the chart, do not select any of them in the collection (or select all of them).
- You can filter the collection, as needed, before opening chart view.
- Select (Bar charts) or (Line charts) in the chart pane.
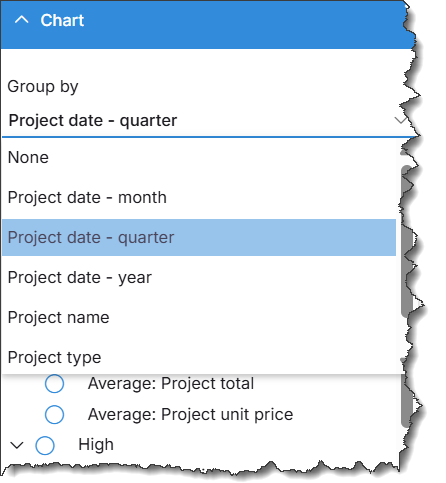
- Click on Group by to display the list of available grouping options.
- Select the field you want to use for grouping. Available options include list fields such as Project type, Project name, or time intervals.
- In the field list, select the data to display in the chart (Average, High, Low, or Total). You can select multiple values and display them together in the same chart.
- To remove some of the projects from the chart, expand the Legend and click each project you want to remove. To show all the projects in the chart, select the Show all check circle.
Create donut charts
- To open the chart panes, click
 from one of the following:
- Single project page or single budget page with Elements selected
- Project, element, item, or budget collection
Tips
- If you sort the collection by a specific column before you open the chart panes, the chart will reflect that sort order. For example, if you sort the collection by the Grand Total column, the chart will sort in order by grand total.
- You can select the projects, elements, items, or budgets in the collection to use for the chart before opening the chart panes.
- You can filter the collection, as needed, before opening the char panes.
- Compare projects or Compare budgets page
- In the Chart options pane, click
 .
- If the cost groups (Uniformat, MasterFormat) list is available, you can select a cost group to determine how the data is grouped in the chart.
- In the field list, select the data to show in the chart, e.g., Project size, Labor amount, Equipment amount.
Use the Search box to quickly locate data fields in the list.
- To change how the donut chart legend is sorted, click one of the links at the bottom of the legend:
- To sort the legend by percentage from highest to lowest, click Sort by Percentage.
- To sort the legend in the order defined by the selected chart view, click Sort by <view name>.
- To remove some of the projects or budgets from the chart, expand the Legend and click each project you want to remove. To show all the projects or budgets in the chart, select the Show all check circle.
Create scatter charts
- To open the chart panes, click
 from one of the following:
- Project, element, item, or budget collection
Tips
- If you sort the collection by a specific column before you open the chart panes, the chart will reflect that sort order. For example, if you sort the collection by the Grand Total column, the chart will sort in order by grand total.
- You can select the projects, elements, items, or budgets in the collection to use for the chart before opening the chart panes.
- You can filter the collection, as needed, before opening the chart panes.
- Compare projects or Compare budgets page
- In the Chart options pane, click
 .
If you are generating the chart from the Compare projects page, choose one of the following options. Otherwise, skip to the next step:
- Regular: Use this option to correlate two comparison columns to each other. For example, if you want to see how labor hours correlate to equipment hours for concrete.
- Pivot (available only in KPIs view with key quantities selected): Use this option to correlate two key quantities to each other for a single comparison column. For example, if you want to see how concrete compares to excavation for the quantity.
- Under X Values, select a value for the X axis.
- Under Y Values, select a value for the Y axis.
Use the Search box to quickly locate data fields in the list.
Hover tips are available so you can see the details for plot points.
- Remove some of the chart data (trendlines, standard deviations, etc.).
- To remove some of the chart data, expand the Legend and select the data you want to remove.
- To show all the data in the chart, expand the Legend and select the Show all check circle above the data list.
- To remove some of the projects or budgets from the chart, expand the Legend and click each project or budget you want to remove.
- To show all the projects or budgets in the chart, select the Show all check circle.
Create high-low charts
- To open the chart panes, click
 from one of the following:
- Single budget page
- Project, element, item, or budget collection
Tips
- If you sort the collection by a specific column before you open the chart panes, the chart will reflect that sort order. For example, if you sort the collection by the Grand Total column, the chart will sort in order by grand total.
- You can select the projects, elements, or items in the collection to use for the chart before opening chart view.
- You can filter the collection, as needed, before opening chart view.
- Compare projects or Compare budgets page
- In the options pane, click
 .
- Choose from the following options:
- Regular or Box plot: Select the style for the high-low lines: regular or box plot (Box plots present the maximum value, upper quartile, median, mean, lower quartile, and minimum value for the data.) .
- Columns or Rows: Display the high-low lines in columns or rows.
- Small, Medium, or Large: (This option is not available for the single budget page.) Select the desired chart size.
- From the Cost groups list, select a cost group to determine how the data is grouped in the chart.
In the field list, select the data to show in the chart, such as Project size, Labor amount, Equipment amount.
Use the Search box to quickly locate data fields in the list.
- Hover tips are available so you can see the details for each high-low line.
To remove some of the chart data (standard deviations, etc.), expand the Legend and select the data you want to remove. To show all the data in the chart, expand the Legend and select the Show all check circle above the data list.
To remove some of the projects or budgets from the chart, expand the Legend and click each project or budget you want to remove. To show all the projects or budgets in the chart, select the Show all check circle.
Create a time-based (Time series) chart
- To open the chart panes, click
 from a project, element, or item collection.
Tips
- You can select the projects, elements, or items in the collection to use for the chart before opening the chart panes. To include all the objects in the chart, do not select any of them in the collection (or select all of them).
- You can filter the collection, as needed, before opening chart view.
- In the Chart options pane, switch Time series to the on position to base the chart on a time interval.
- Select the desired chart type: Bar, Line, Scatter, or High-low.
- Choose the desired time interval: Month, Quarter, or Year.
- Select other options for the chart based on the selected chart type.
- In the field list, select the data to show in the char.
- To remove some of the projects from the chart, expand the Legend and click each project you want to remove. To show all the projects in the chart, select the Show all check circle.
Resize a chart
Drag one of the chart borders to resize it.
Change the chart display option (Horizontal/Vertical)
You can display charts below the grid or on the right side of the grid. Select an option to change where the chart displays on the page:
- Horizontal: To display the chart below the grid, click
 (located above the grid).
- Vertical: To display the chart on the right side of the grid, click
 .
View a chart full screen
To view a chart full screen, do one of the following:
- Click
 on the top border of the chart pane.
- Click
 in the top right corner of the chart and select View full screen from the menu.
To exit full screen view:
- Click
 on the top border of the chart pane.
- Click
 again and select Exit full screen.
Zoom in/out
Use the mouse to drag down or up to zoom in and out in the chart. To reset the zoom, click Reset zoom in the top right corner of the chart.
Remove outliers
Use this procedure to remove data (project, element, or item) from the chart and from the collection or comparison used to create the chart without having to leave the chart.
In the chart, left-click the bar, slice, or plot point that represents the data you want to remove and click Remove.
Save a chart as an image
To save a chart as a PNG or JPEG, click  in the top right corner of the chart and select Save PNG image or Save JPEG image from the menu.
You can import the chart image into a graphics editing program, such as Microsoft Paint or PaintShop Pro, or into Microsoft Excel.
Save a chart as a PDF
To save a chart as a PDF click  in the top right corner of the chart and select Save PDF from the menu.
Open a record from the chart
Use this procedure to open are cord (project, element, or item) from the chart without having to leave the chart.
In the chart, left-click the bar, slice, or plot point that represents the record you want to open and click Open.
In Cortex 365, scatter charts do not include linear trendlines, standard deviation lines, y = mx +b formula, or R2 value.